
The price of Bitcoin dropped close to $70,000 on Friday after a strong rebound earlier in the week. Investors are becoming cautious as a large Bitcoin options expiry worth about $2.22 billion is scheduled today, which could cause increased market volatility.
Recent Bitcoin Price Movement
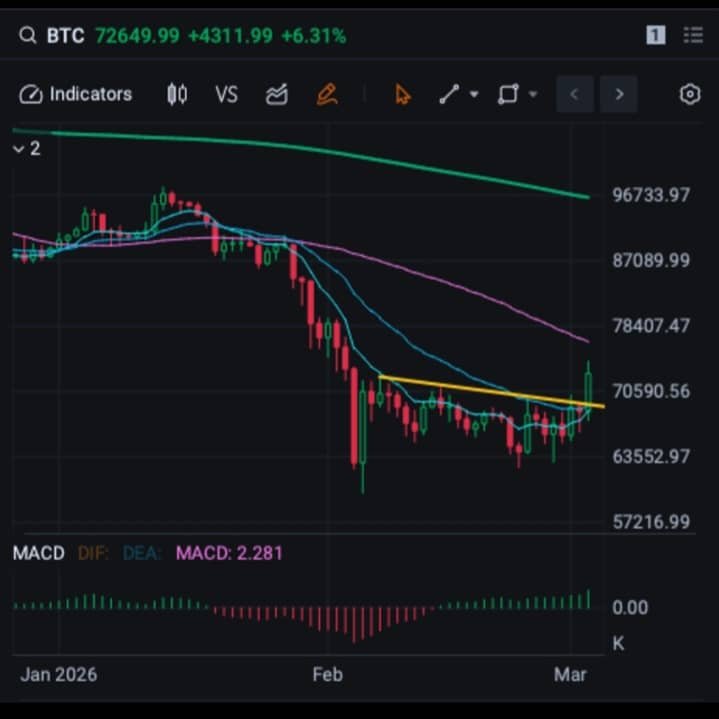
Bitcoin fell about 4.5%, reaching an intraday low of $70,177 before stabilizing near $70,400. The decline happened after the cryptocurrency failed to break the $74,000 resistance level, a price barrier it has struggled to move above for more than a month.
Even with the drop, Bitcoin had already gained over 15% during the previous five days. Because of that rapid rise, many investors decided to take profits, which contributed to the short-term pullback.
Global Tensions Affecting the Market
The broader financial market has also been influenced by geopolitical tensions between the United States and Iran, which pushed energy prices higher and increased uncertainty among investors. In uncertain times like this, many traders move their money into traditional safer assets instead of riskier ones such as cryptocurrencies.
Large Bitcoin Options Expiry
A major factor affecting market sentiment today is the Bitcoin options expiry on the Deribit exchange.
Key details:
- Around 31,500 Bitcoin option contracts will expire.
- The total value of these options is about $2.22 billion.
- The put-to-call ratio is 1.72, meaning more traders are betting that Bitcoin’s price could fall.
Another important level traders are watching is the “maximum pain” price, which is currently around $69,000. This is the price where most options expire without value, and markets sometimes move toward this level as expiry approaches.
Because of this, Bitcoin could temporarily move closer to $69,000 during the expiry period.
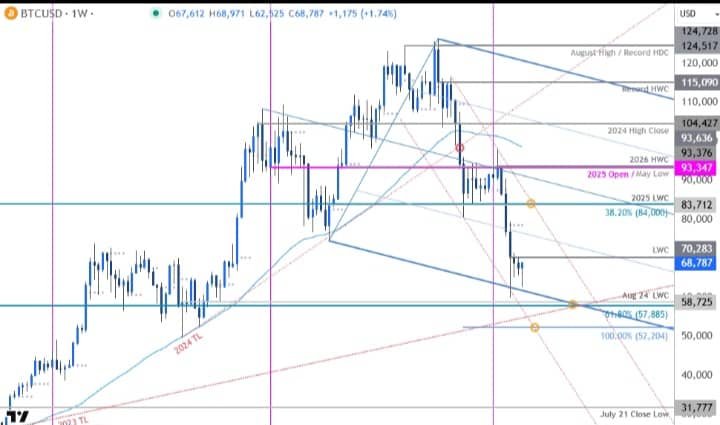
Important Support and Resistance Levels
Bitcoin has struggled to stay above $70,000 several times since February. If the price drops below this level again, short-term traders may become nervous and start selling.
Key levels to watch:
Resistance levels
- $72,000
- $74,000
Support levels
- $70,000
- $69,000
- $60,000
Technical Indicators
Despite the current pullback, technical indicators still show some positive signals:
- The MACD indicator is trending upward, suggesting buying pressure is increasing.
- The Relative Strength Index (RSI) shows a bullish divergence, which often signals potential upward momentum.
If Bitcoin manages to break above $72,000, the recent downward pressure could end quickly. However, if the price falls below $70,000, it may drop toward $69,000 or even $60,000 due to a bearish flag pattern forming on the chart.
Overall Outlook
Even with the current volatility, Bitcoin recently recovered from around $60,000 earlier this year, showing that demand in the market is still strong.
In simple terms:
Bitcoin’s drop is mainly caused by profit-taking and a large options expiry event, not necessarily a major crash.
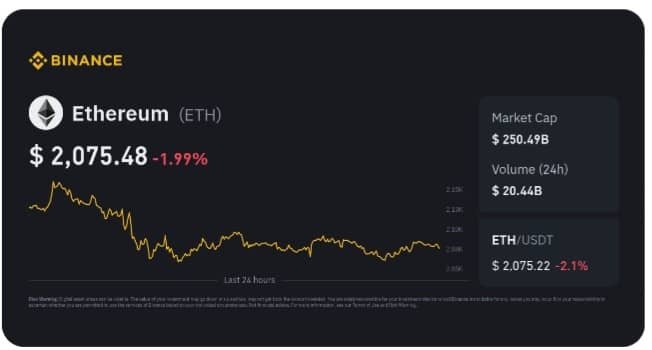
Ethereum (ETH)
Ethereum is currently trading slightly above $2,000, but the market shows signs of weakness after failing to break an important resistance level.
On Thursday, the price dropped about 2% before reaching the 50-day EMA, which is acting as a resistance area. The 100-day and 200-day EMAs are still trending downward, showing that the broader trend is still bearish.
Some indicators show mixed signals:
MACD is still above the signal line, meaning buyers still have some strength.
However, the histogram is getting smaller, suggesting the bullish momentum is slowing.
RSI around 49 shows the market is neutral — neither strongly bullish nor bearish.
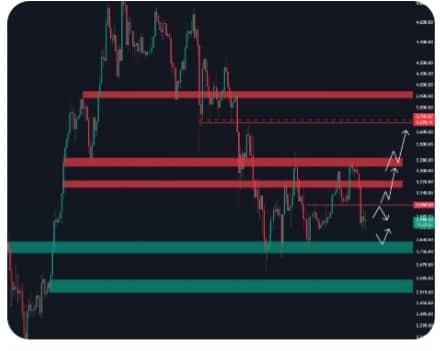
If the price drops further, the next strong support could be around $1,747, which was a previous swing low.
On the upside, Ethereum faces strong resistance between $2,236 and $2,279. This zone includes the 50-day EMA and a key retracement level.
If ETH closes above this area, the next target could be around $2,616.
Ethereum’s price recently moved around $2,050–$2,070 with daily fluctuations in the market.
XRP
XRP is trading near $1.40 and remains in a weak trend.
The price is still below the 50-day, 100-day, and 200-day EMAs, which are all pointing downward. This shows the market is still under selling pressure.
Indicators show:
MACD slightly positive, meaning selling pressure is slowing.
RSI around 45, indicating weak momentum but not oversold.
Right now XRP is moving sideways between $1.33 and $1.50.
Possible scenarios:
Above $1.50 → price could move toward $1.56 (near the 50-day EMA).
Below $1.33 → the price may continue
Ethereum Slightly bearish $1,747 $2,236 – $2,279
https://cryptodaily.meeqam.com/


 Bitcoin
  Ethereum
  Tether
  BNB
BNB  XRP
XRP  USDC
USDC  Solana
  Figure Heloc
  Dogecoin
  USDS
USDS  WhiteBIT Coin
  LEO Token
  Hyperliquid
  Wrapped stETH
  Cardano
  Bitcoin Cash
  Wrapped Bitcoin
  Binance Bridged USDT (BNB Smart Chain)
  Ethena USDe
  Canton
  Zcash
Zcash  Wrapped eETH
  Stellar
  MemeCore
  sUSDS
sUSDS  USD1
USD1  Litecoin
  Coinbase Wrapped BTC
  Avalanche
  Hedera
  WETH
WETH  Sui
Sui  Shiba Inu
  USDT0
USDT0  Bittensor
  Toncoin
  World Liberty Financial
  Circle USYC
  PAX Gold
  Ethena Staked USDe