
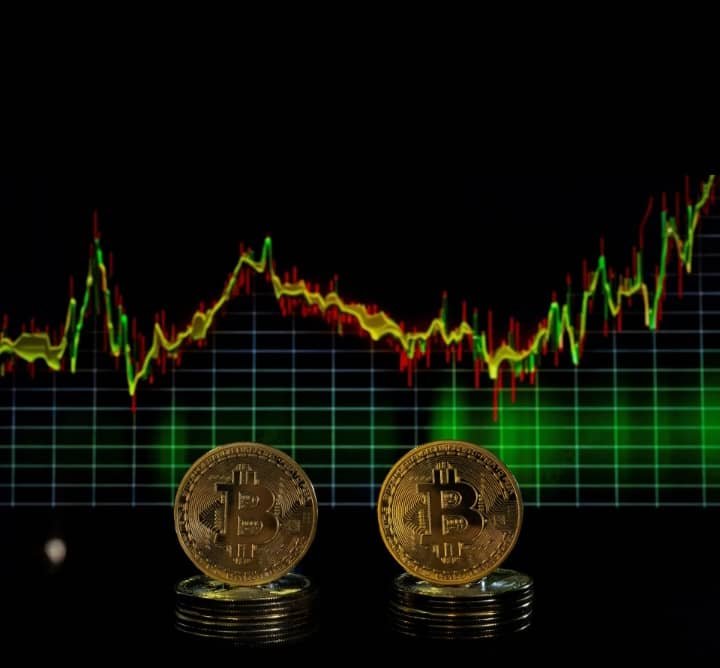
Bitcoin is currently trading in the $70,000–$71,000 range as of March 2026, and its recent price action has become noticeably less volatile compared to earlier swings. Technical indicators across both daily and 4-hour charts suggest a balanced, neutral to bullish outlook. The RSI (14) sits around 54, indicating neither overbought nor oversold conditions, while the MACD hovers near zero and the Stochastic oscillator remains mid-range classic signs of consolidation.
Key price levels are clearly defined. Support lies around $68,000–$69,000, with a deeper safety zone near $60,000, while resistance stands between $72,000 and $74,000, capped by a psychological barrier at $75,000. Although volatility has cooled slightly, daily moves of around 5% show the market is still active. External forces such as geopolitical tensions, energy prices, and strong ETF inflows continue to influence price direction. Overall, the setup leans cautiously bullish, with a confirmed breakout above $73,000–$74,000 signaling potential upside toward $75,000–$76,000, while a drop below $68,000 could trigger downside risk.
Current Price & Technical Setup
At present, Bitcoin is consolidating after a strong mid-March rally, where price surged from approximately $66,000 to $74,000 before stabilizing. The daily chart reflects this pause, while the 4-hour chart shows a rising channel between $66,000 and $75,000, indicating a controlled uptrend rather than aggressive momentum.
Technical indicators across timeframes reinforce this consolidation phase. Oscillators remain neutral, suggesting the market is waiting for a catalyst. Meanwhile, price action staying above shorter-term moving averages hints that buyers still maintain some control in the near term.
Moving Averages & Market Bias
The moving averages present a subtly bullish picture. Bitcoin is currently trading above its 20-day and 50-day moving averages, both of which have started to slope upward an encouraging sign for short- and medium-term momentum.
However, the 100-day and 200-day moving averages remain above the current price, indicating that the broader trend has not fully flipped bullish yet. These longer-term averages are still trending downward, acting as overhead resistance. This creates a mixed structure, where short-term strength contrasts with longer-term caution a typical setup during transitional market phases.
Volatility and Trading Range
Volatility has eased compared to earlier spikes but remains meaningful. The 14-day Average True Range (ATR) suggests daily price swings of several thousand dollars, emphasizing the need for careful risk management. At the same time, Bollinger Bands are narrowing, signaling a potential volatility squeeze often a precursor to a significant breakout.
Support, Resistance & Market Structure
Price levels are well-defined and critical for traders. On the upside, the $72,000–$74,000 zone acts as immediate resistance, with $75,000 serving as a key psychological ceiling. On the downside, $68,000–$69,000 is the first support level, followed by a stronger base near $60,000–$64,000 if selling pressure increases.
Recent price action confirms this structure, with buyers stepping in consistently around support zones and sellers defending resistance levels.
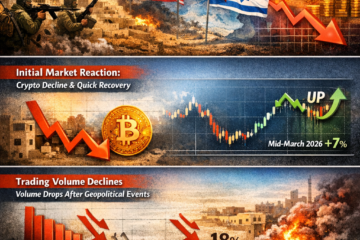
Recent Market Events
Market movements in March highlight how sensitive Bitcoin is to external news. Around March 9, price stabilized near $66,000 after a decline. By March 15, strong ETF inflows and easing geopolitical concerns pushed Bitcoin toward $74,000. However, on March 22, escalating tensions particularly involving U.S. military actions triggered a sharp drop to around $63,000. Just days later, on March 24, the market rebounded quickly to near $69,000 as buyers re-entered.
Risk Factors & Catalysts
The current environment shows that macro and geopolitical factors are as influential as crypto-specific developments. Rising energy prices linked to Middle East tensions, a strong U.S. dollar, and interest rate uncertainty have all weighed on sentiment. When the Federal Reserve signaled limited rate cuts for 2026, Bitcoin briefly slipped below $70,000, highlighting its sensitivity to monetary policy.
On the positive side, strong inflows into Bitcoin ETFs estimated around $2.9 billion weekly are supporting demand. These inflows are increasingly acting as a stabilizing force, helping offset volatility during periods of uncertainty.
Retail participation, however, remains subdued, particularly in the U.S., while Asian markets show stronger activity. This imbalance suggests that a major catalyst such as regulatory clarity or a macro shift may be needed to drive the next big move.
Trade Implications
Given the current setup, traders are facing three primary scenarios:
Bullish Case:
If Bitcoin holds above $72,000 and breaks through $74,000, momentum could accelerate quickly toward $75,000–$76,000, potentially triggering a short squeeze and stronger buying pressure over the coming weeks.
Bearish Case:
A breakdown below $68,000 support could lead to a sharp decline toward $63,000, with further downside risk extending to the $60,000–$64,000 range.
Range-Bound Scenario:
If neither breakout nor breakdown occurs, Bitcoin is likely to trade sideways between $68,000 and $74,000, offering opportunities for range-based trading strategies.
Conclusion
In summary, Bitcoin’s current market structure reflects a consolidation phase with a bullish tilt. Neutral oscillators combined with improving short-term moving averages suggest that the market is building energy for its next move. Whether that move is upward or downward will largely depend on key price levels and external catalysts, including macroeconomic signals, geopolitical developments, and continued ETF inflows.


 Bitcoin
  Ethereum
  Tether
  XRP
XRP  BNB
BNB  USDC
USDC  Solana
  Figure Heloc
  Dogecoin
  USDS
USDS  WhiteBIT Coin
  LEO Token
  Cardano
  Wrapped stETH
  Bitcoin Cash
  Hyperliquid
  Wrapped Bitcoin
  Binance Bridged USDT (BNB Smart Chain)
  Ethena USDe
  Canton
  Stellar
  Wrapped eETH
  MemeCore
  sUSDS
sUSDS  USD1
USD1  Litecoin
  Coinbase Wrapped BTC
  Zcash
Zcash  Hedera
  Avalanche
  WETH
WETH  Shiba Inu
  Sui
Sui  USDT0
USDT0  World Liberty Financial
  Toncoin
  Bittensor
  Circle USYC
  PAX Gold
  Ethena Staked USDe